
Online calculator: Audio file waveform (planetcalc.com)
PCM audio data is stored as a sequence of signal amplitude samples recorded at regular intervals. E.g. one second of the low-quality 8kHz audio consists of 8000 amplitude samples. To display every point of this fragment as is, you need at least an 8000-pixel wide display.
Therefore, we need an algorithm to reduce the visual representation of the waveform.
The algorithm uses the root mean square (RMS) algorithm to represent a sample set as a single line on the waveform graph.
- Determine the number of graph width points P
- Determine the number of samples per point S=T/P, where T – total number of samples
- For every point, calculate RMS:
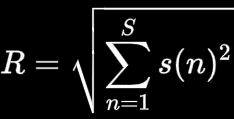
where s(n) – is the n-th sample of a given point - For every point, draw a vertical line from -R to R
Hint
Audio amplitude samples are stored as integer values in PCM format. The calculator converts the integer amplitudes to float ones in range (-1…1) to represent the signal waveform on the graph uniformly.
PCM format can store two types of integer data. If the integer sample size is less or equal to 8 bits (one byte), it is stored as an unsigned value. Otherwise (more than 8 bit), it’s two’s complement signed.
The calculator transforms 8-bit integer data to float in this way: (s(n)-128)/128. The greater integer data (16, 24, or 32-bits long) is converted to float as s(n)/|int_min|. |int_min| equals to 32768; 8388608 or 2147483648 for 16, 24 or 32-bit integer respectively.